

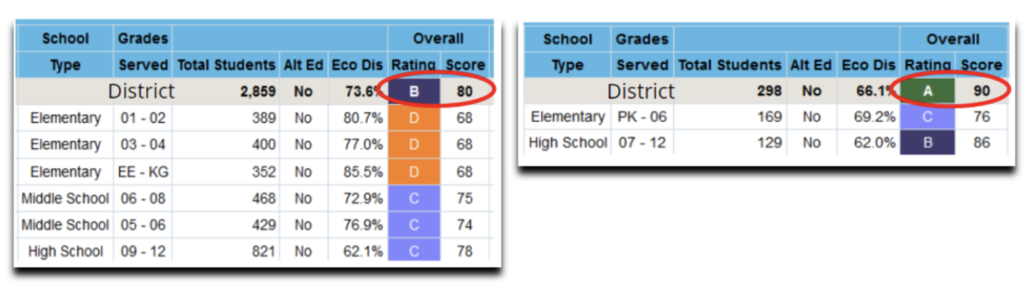
Prior to 2023, district-level targets and cut scores were used by the Texas Education Agency (TEA) to rate districts. This led to about 30% of district ratings being disconnected from their campuses’ ratings.
For example, a district may have received an “A” or “B” rating while its campuses were rated “B”, “C”, or “D”. This disconnect was largely due to district-level College, Career, and Military Readiness (CCMR) and graduation rates. In 2023, TEA began using a proportional weighting by domain method to determine district ratings.
Proportional Weighting by Domain Implemented
Following feedback and analysis, the TEA introduced a proportional ratings methodology for calculating district ratings. The accountability system now includes the proportional weighting methodology to rate districts for each of the three domains:
- Student Achievement
- School Progress, and
- Closing the Gaps
The number of students enrolled in grades 3–12 dictates the proportional weighting methodology.
How to Determine a Campus’s Proportional Weight
For example, to determine a campus’s proportional weight, the number of students enrolled (grades 3–12) at a campus is divided into the total number of students enrolled in the district.
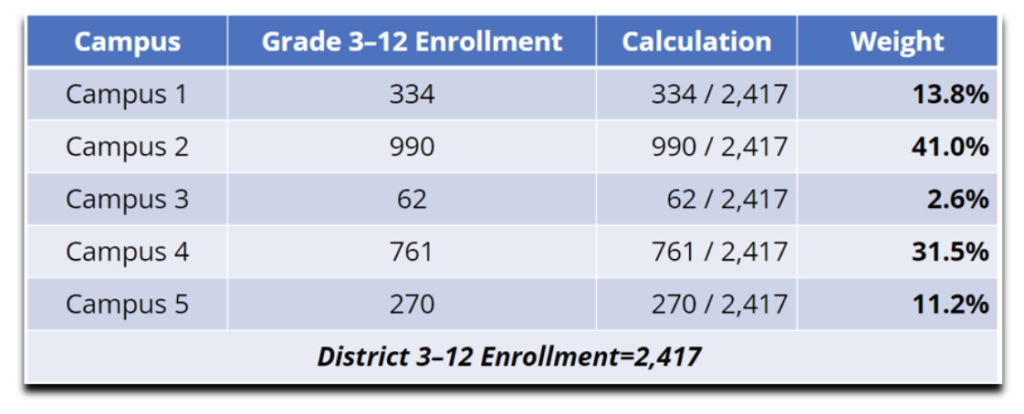
In Image 2, we divide Campus 1’s 334 students by the total number of students in the district, which is 2,417. This resulted in a proportional weight of 13.8%. 13.8% is the campus percentage that will add to the district domain score. Each campus repeats this calculation, adding their number to the district total.
With the proportional weighting methodology, campuses with a higher student enrollment have a higher impact on a district’s overall domain score.
The district multiplies the campus domain scaled score by the proportional weight or percentage to determine how many points are applied to the district’s domain score.
How Each Campus Contributes to the Domain Score
In Image 2, Campus 1 adds 11.7 points to the district’s domain score. This is after multiplying its domain score of 85 by its proportional weight of 13.8%. Again, each campus repeats this calculation, with points going toward the district domain score.
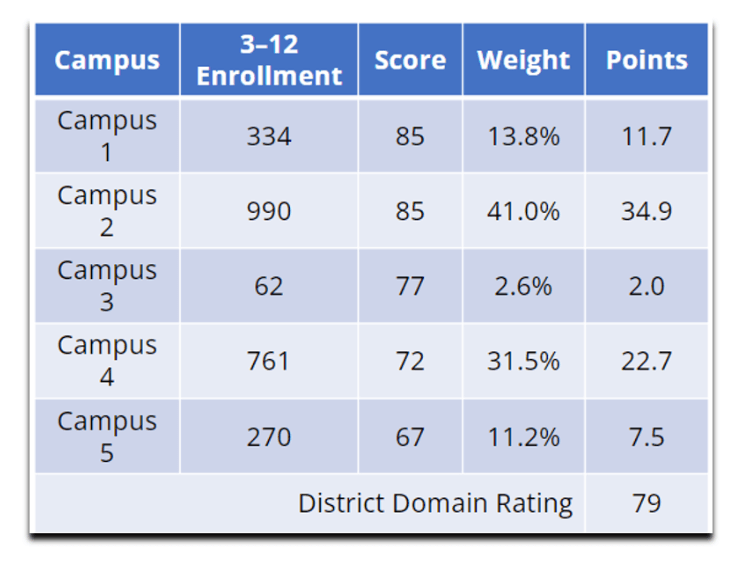
The sum of all the points for all campuses will determine the district domain score.
In Image 3, the district domain score will be 79, a “C” rating. This approach ensures a fair and accurate assessment that goes beyond simplistic metrics. Image 4 depicts how campus enrollment numbers and their proportional weight affect a district’s domain score.
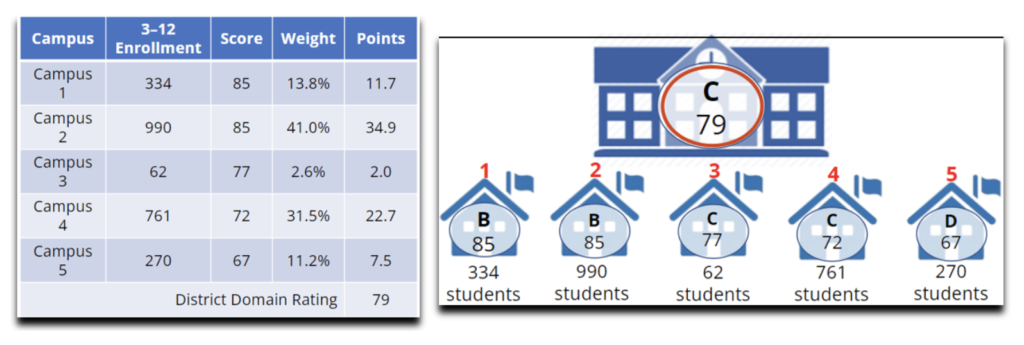
In Image 4, the district’s domain score of 79, or C-rating, closely represents and aligns with the domain ratings of all five of its campuses.
The Effects of Proportional Weighting Methodology
Proportional weighting provides a more refined approach, affirming a campus’s distinct weight in evaluating a district’s overall performance. The proportional weighting methodology also provides a more accurate and fair evaluation of school district performance.
Additional Accountability Resources
The ESC Region 13 Accountability Team produced a video explaining the details of the Proportional Weighting Methodology and District Rating. The video explains how to calculate an individual campus rating and add it to the district total.
ESC Region 13 also created a District Proportional Weighting Methodology Template to help districts easily make these calculations. The template utilizes the October snapshot data and automatically calculates the weighting by inserting enrollment numbers for grades 3–12.
Conclusion
For a weekly update on the latest accountability news, subscribe to our Accountability Weekly newsletter.
Contact our Accountability Team with any questions. One of our Accountability Specialists can offer assistance and guide you through the multiple accountability changes. Customized professional development services are available for campuses or districts.

Robert Garcia
Robert Garcia is a School Improvement Administrative Specialist and member of the Region 13 Accountability Team.


Add comment