

Academic Growth calculation is one of the big changes in the refreshed A-F Accountability System. TEA continues to evaluate growth in multiple ways.
In this blog, we will take a look at navigating how Academic Growth in Domain 2 is approached using transition tables.
Academic Growth and Transition Tables
Domain 2, School Progress Part A has a significant change in what growth looks like. The prior way of calculating growth in Part A relied solely on the analysis of vertical scale scores. This prevented growth analysis if students switch from Spanish-language to English-language testing. It also limited growth calculations for high schools because of the difference in end-of-course (EOC) vertical scaling (grade 8 reading/language arts [RLA] to English I EOC).
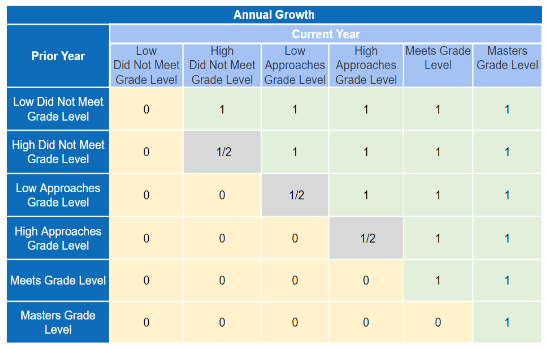
The new approach will use a transition table based on expanded STAAR performance levels. These expanded performance levels split Does Not Meet into Low Does Not Meet and High Does Not Meet, and expands Approaches into Low Approaches and High Approaches.
Part A: Academic Growth
Part A: Academic Growth will look at growth using a transition table. Here you can see the annual growth transition table, including the expanded STAAR performance levels, followed by an example transition table.
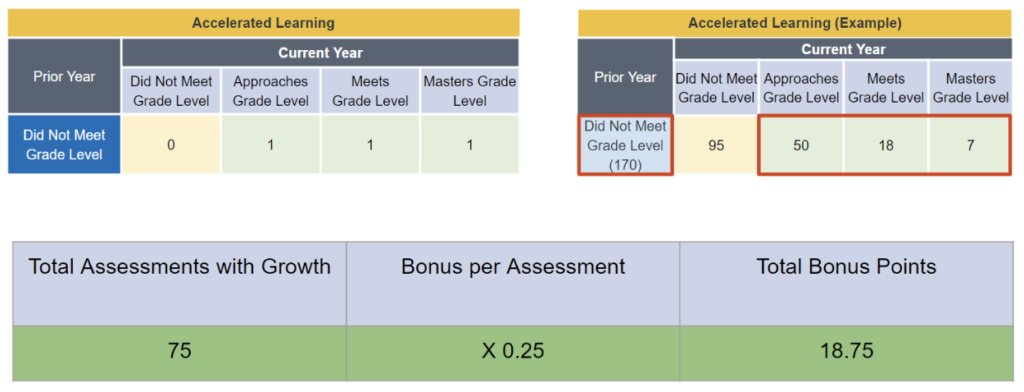
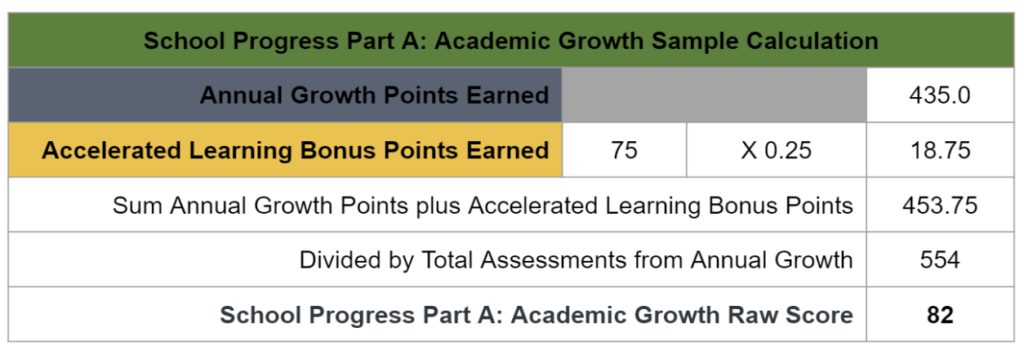
TEA has shifted Accelerated Learning to a bonus points methodology. Each successfully accelerated test will count as 0.25 “bonus points” in the numerator of the annual growth calculation.
Accelerated Learning is calculated using this new method:
Number of students who Did Not Meet Grade Level in the prior year who then earned either Approaches, Meets, or Masters in the current year x 0.25 = Accelerated Learning Points
For School Progress Part A
Calculations for School Progress Part A: Academic Growth include Annual Growth and Accelerated Learning bonus points.
Campuses earn credit for maintaining performance or demonstrating growth in RLA and Math.
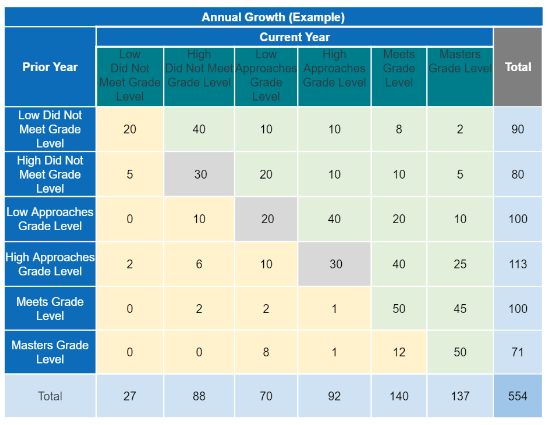
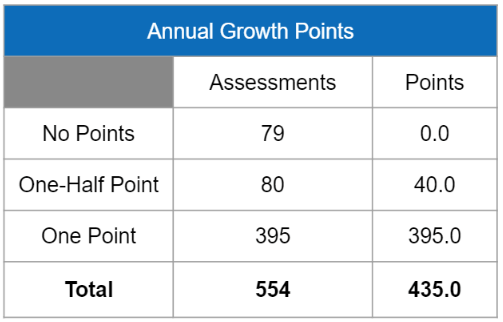
Using the examples above, we can see an example of the Academic Growth calculation here, including the final Raw Score:
Navigating and understanding the A-F Accountability System Refresh can seem daunting. Digesting new information in bite-sized chunks can help. Here we have discussed the basics for calculating School Progress Part A: Academic Growth.
Read about other changes in A-F Accountability like Understanding the Impact of SB 1365 on the ESC Region 13 blog.
Subscribe to Accountability Weekly for the latest information on the update.

Rick is an Administrative Specialist of Data Systems and Accountability here at the Education Service Center Region 13.


Fostering accountability in education? That’s the key to developing future superstars! When responsibility intertwines with learning, amazing things occur. It’s all about taking charge of the journey, enhancing skills, and demonstrating that growth and determination are a perfect match!