

One of the greatest challenges in education has been pulling data to make pedagogical decisions to increase the effectiveness of teaching and learning. Now, in the ever-changing landscape of education, data is taking an even more prominent role. We need to use available tools to access and assess how our students are doing.
One such data tool is Eduphoria, an online program that allows schools to manage student assessments, curriculum, staff development, and of course, monitor student progress.
But just looking at data isn’t nearly enough. You need to know what items to analyze and what to do once you have that information. Let’s dive into how to make that happen!
What to Consider When Analyzing Data
Eduphoria recently rolled out some new features for teachers that were formerly only available to administrators. You can now create your own data view to hone in on specific information you want to analyze, whether that is a view of a specific test, sorting by demographics or Student Expectations (SE), and more!
But before you jump into creating a new Data View, you need to think through what you’d like to analyze. Here are some things to consider:
- Passing rates
- Student responses
- Trends over time
- Reporting categories
- Approaches or Meets or Masters achievement
Then, identify what data points you don’t care to see on a report. This could include:
- Student demographics
- Raw scores
- All of the Approaches/Meets/Masters achievement
Here is a sample report, or Data View, that you normally would pull from Eduphoria, by selecting the type, year, grade, subject, etc.:
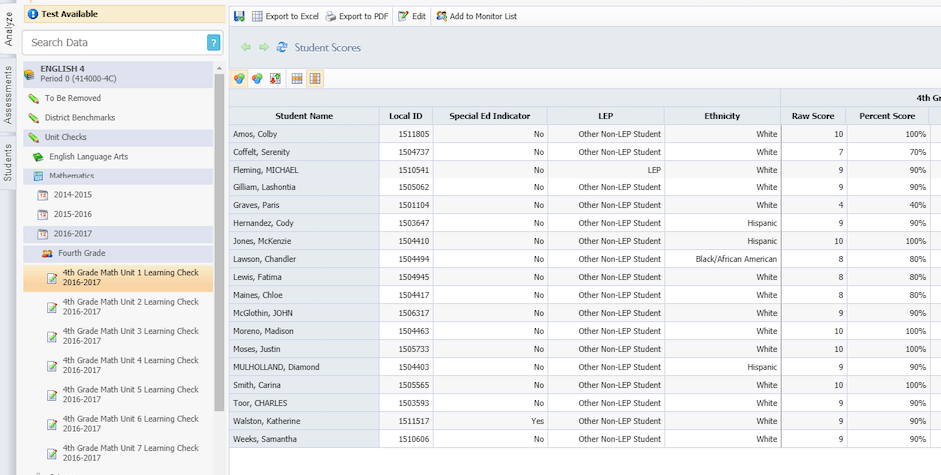
But now, you can create a new view with only the data that matters to you. Eduphoria has a step by step guide on how to do this.
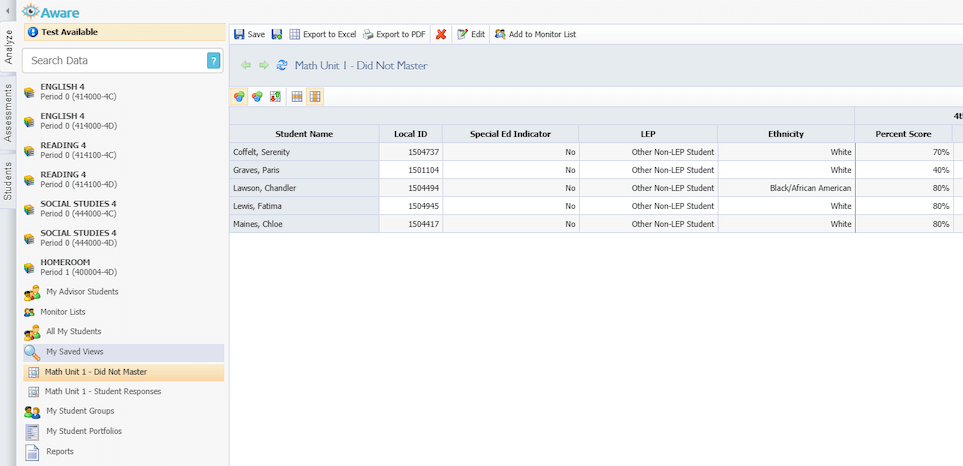
First, rename and save the report, exclude data you are not looking at, and set filters (Did Not Master) on the same Data View as above, but now it is more relevant to what you are truly looking for.
Here is the same report, but with the ability to EDIT what you see:
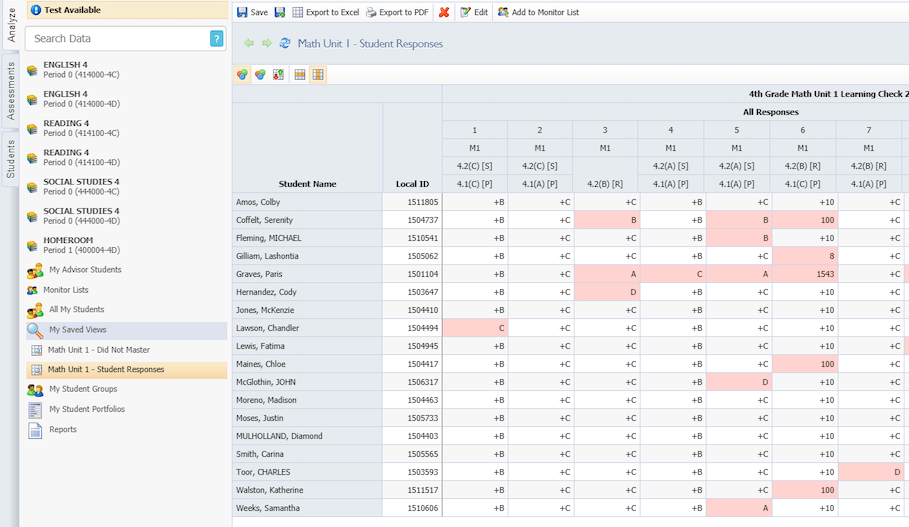
You can also create your own data view of each student’s responses on the exact same assessment:
You Have Student Data. Now What?
As a teacher, the above report can help see what questions specific students missed. It can help pinpoint where individuals, the class, or entire groups of students struggle with a Student Expectation. It can also show you if most students are selecting the SAME incorrect response, and that may be a cause to look at the question and answer choices.
Of course, there are other Data Views that you can edit to help you make educational decisions for your students and lessons. For instance, how might you plan, looking at the first 4 Unit Checks in Math, and seeing how your students have been performing as a class and individually? How could you plan to re-teach by looking at the trends for specific Student Expectations and/or Reporting Categories?
Here are few other things that examining data can facilitate:
- Create a Monitor List based on students falling below a specific level. This could be a percentage (<70%), Does not meet Approaches, or has failed to pass two or more Unit Checks
- Create a Trend Report to look at student performance on SEs over time (or multiple assessments)
- Look at ‘distractor’ answers and how students responded
- Drill-downs to a student portfolio allows you to see all assessments for a student you currently have on your roster. Track how that student has done over time, including local and State assessments
Teacher Takeaways
We’ve really only mentioned what our students are doing, or how they have done, relative to the data. But, have you considered how YOU have been doing? Just a few observations that you can review about your own teaching:
- SEs that have not been tested at all
- SEs that have been over-tested
- Too many, or too few, assessments over a given period of time
- SEs tested above or below grade level
- The number/percent of students passing or failing assessments
Looking critically at how you’ve taught the content is just as important as how your students performed. This can give you insight into the need for upping the rigor with your assignments, making sure you’re focusing the appropriate amount on each of the TEKS, and more.
Finally, by analyzing student data, students can learn better, teachers can teach better, and we have a way to better inform our educational practices. Just be sure to review and analyze your student data regularly to make the greatest impact!
To learn more about how to best utilize student data, attend one of our upcoming Eduphoria Workshops for Teachers!

Rick is an Administrative Specialist of Data Systems and Accountability here at the Education Service Center Region 13.


Add comment