

When it comes to assessment, one of the biggest challenges for any tested grade level or content area is time. How do teachers and leaders distinguish between concepts that may need a quick refresher versus a more focused, in-depth review? Enter the power of heat maps. More than just a colorful chart, heat maps transform percentages into a visual spectrum that creates a road map for teachers and students. This provides a path to growth that isn’t just working harder but working smarter.
Empowering Students to Own Their Learning
Heat maps are a tool that transforms data into a story of its own academic trek, highlighting the peaks students have conquered and the paths that still lie ahead. Creating a heat map with individual student data encourages students to be more than passive recipients of a score. They become data analysts, celebrating areas of strength and identifying areas for growth.
A fifth-grade student might look at the results of an assessment that covers Strand 1 (Matter and Energy) and feel like they will never be successful in that area. But after using this tool for the assessment, they realize it can be narrowed down to one specific concept in the Strand.
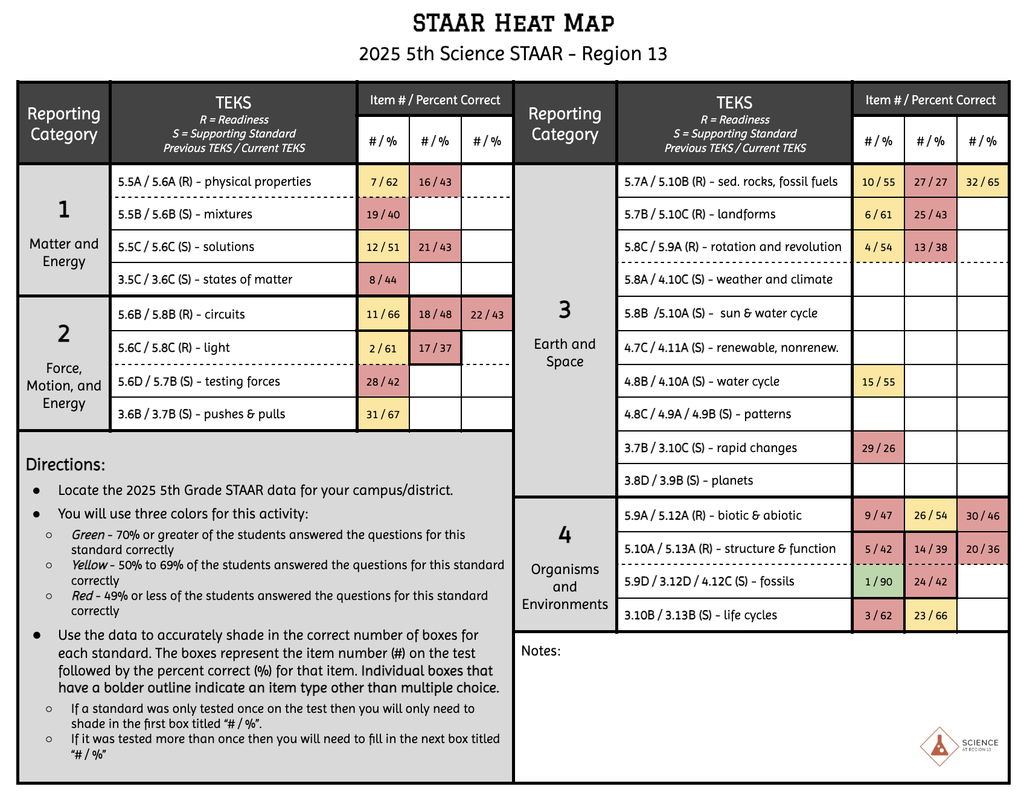
For example, in the heat map below for Strand 1, there is only one red box for physical properties. So the student can work smarter not harder, by focusing on that particular concept.
Strategic Review
Heat maps can also help teachers work smarter and not harder when it comes to determining exactly which concepts are still a challenge for students.
Whether it is STAAR/EOC or benchmark data, heat maps show you a path forward. For example, if a teacher notices that yellow and red are the dominant colors for a particular Strand, it could indicate an area of growth for all students and might be an opportunity for a whole-group reteach.
However, if there is one standard in the Strand that is denoted by yellows/reds, the teacher can create a plan around the concepts tied to that standard instead of reviewing the entire Strand. To get a better idea, go to the 8th grade heat map.
Using Heat Maps
Using heat maps to create a review plan helps teachers focus on the specific needs and challenges of the students in their classroom. Since every group of students is different, a review in one classroom might look different from another — it is based on the data for the students in each of those classes. They are also a great way to meet students where they are and help them achieve success on assessments. What would you focus on based on the data shown in the Biology EOC heat map?
Conclusion
We’ve all been there — staring at a data report and trying to determine the next steps. The beauty of a heat map is its simplicity. It cuts through the noise and helps teachers determine where the energy and focus is needed the most. By implementing heat maps, you give classrooms a shared language of success and a picture of progress.
Do you have more questions on how heat maps can benefit your classroom? Reach out to the ESC Region 13 Science Specialists. We invite you to subscribe to our newsletter for the most up-to-date science news and information. Or, visit our website and explore the professional development opportunties, products, and resources. Read more science-related articles on the ESC Region 13 blog.

Vejheh Tavakoli
Vejheh Tavakoli is the Secondary Science Specialist at ESC Region 13.



Add comment